
In many teams, Project Lifecycle is perceived as something "PM-related": documents, phases, statuses, reports. But in practice, it's not about paperwork - it's about predictability, honest communication with the client, and stability in work.

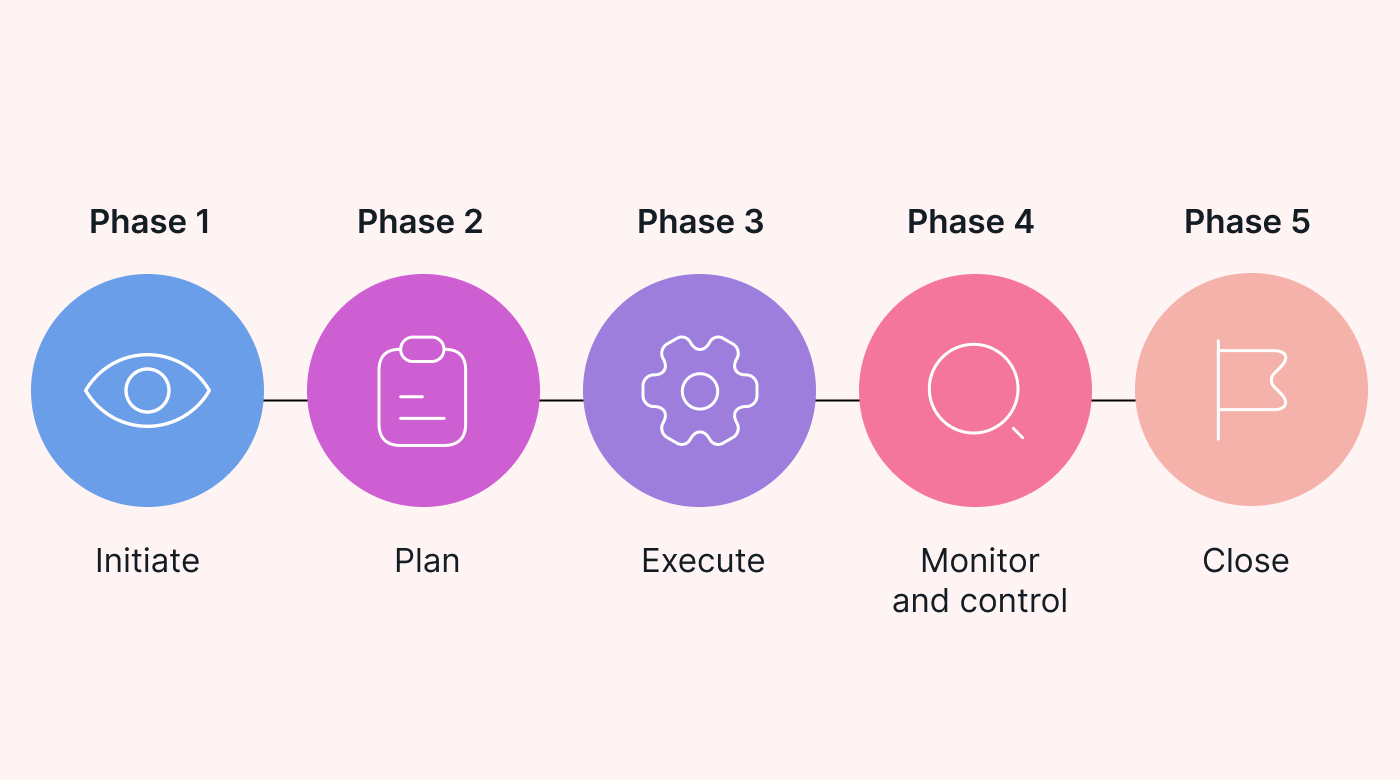
Any IT project goes through five main stages - from the client's request to completion and delivery of results. Each phase has its own key artefacts - documents and tools that create transparency, reduce risks, and help the team move in sync.
Why are artefacts an investment rather than bureaucracy?
Statistics show:
- 39% of project problems arise from an unclear start (PMI)
- 66% of failures are related to uncontrolled budgets (McKinsey)
- 78% of customer dissatisfaction is due to a mismatch with expected value
The main principles that keep the project on track:
- the team must work in such a way that the difference between Planned vs Delivered is minimal (target >80-90%);
- all participants have the same understanding of the scope of work, priorities and responsibilities;
- the result and progress of the work are transparent - the client feels control and trust.
Next, we will examine each phase in detail - what artefacts are created, why the team needs them, and how to understand that everything is going correctly.
1. Initiation - Structure and rules of the game
This is the moment when a project ceases to be an abstraction - it acquires structure, framework, and rules. According to PMI, up to 39% of all project problems arise from an unclear start. Initiation exists to ensure that these problems do not become yours.
Meta phases
Transform the commercial agreement into a working project structure with clear roles, objectives and communication channels.
Artifacts Initiation
🎯 1.1. Business Case
What it is: A document that substantiates the economic and business value of a project.
What it contains:
- The business problem we are solving
- Expected benefits (revenue growth, cost reduction, efficiency)
- ROI and success metrics
- Alternatives and why we chose this approach
Why is it important for the team: It provides a "northern beacon" - an understanding of why the product is being developed in the first place. In an e-commerce project, it is important not to "make checkout," but to "increase mobile conversion by 15%" - this is a completely different approach.
Statistics: Projects without a clear business case are 2.5 times more likely to be cancelled (Gartner)
📥 Template: Business case
📜 1.2. Project Charter
What it is: An official document that "gives birth" to the project and serves as a passport, which the client must sign to confirm their agreement with all terms and conditions.
What it contains:
- Project goals
- Scope (what we do / what we do NOT do)
- Key stakeholders and their roles
- Success criteria
- High-level timeline
Why is it necessary for the team: It establishes the "rules of the game" - what we do, who is responsible, how we measure success. It eliminates conflicts such as "was that agreed upon?" and also serves as official confirmation of agreements with the client.
📥 Template: Project Charter
💬 1.3. Communication Plan
What it is: Communication rules for the entire project.
What it contains:
- Communication channels (Slack, Meet, Email)
- Frequency of meetings (daily standups, weekly syncs, sprint reviews)
- Reporting format
- Escalation procedures
Why the team needs it: Eliminates chaos in communications. Everyone knows when, where, and with whom to talk. No one waits three days for a customer's response.
Statistics: Teams with a clear communication plan respond to risks 30-40% faster.
📥 Template: Communication Plan
⚠️ 1.4. Risk Register
What it is: A register of all potential project risks.
What it contains:
- Description of each risk
- Probability and impact
- Mitigation plan
- Responsible person
Why the team needs it: "Insurance against chaos" - minor problems do not accumulate into a major crisis.
Statistics: Professional risk management reduces critical problems by almost 60% (McKinsey)
📥 Template: Risk Register
🚀 1.5. Kick-off Meeting Facilitation Scenario
What it is: Minutes of the first major meeting with the team and the client.
What it contains:
- Presentation of the solution vision
- Agreement on goals and milestones
- Q&A session
- Action items
Why the team needs it: After the kick-off, everyone has the same understanding of what to do and why.
📥 Template: Kick-off Meeting Facilitation Scenario
How to understand that Initiation has been successful:
- Business Case has been created and agreed upon by all participants
- Project Charter has been signed
- Communication Plan is active
- Risk Register has been completed
- Kick-off has been held, everyone is synchronised
- Roles and communication channels are clear
- Initial technical vision has been agreed upon
2. Planning - From ideas to a concrete plan
After kick-off, planning begins - turning conversations into a clear action plan. This stage lasts 3-10 days (Sprint 0 / Discovery Phase). This is not a "delay" but a time to avoid future problems. It is also important to note that this period is necessarily taken into account in the overall project estimate. It is necessary to allocate sufficient time and resources in advance for the competent implementation of Sprint 0 or Discovery Phase after project initialisation.
Meta phases
Break down the scope of work into manageable blocks, estimate the effort required, and create a roadmap.
Artefacts Planning
🌳 2.1. Work Breakdown Structure (WBS)
What it is: Hierarchical decomposition of the entire scope of work.
Structure:
Epic (large block of functionality)
↳ Feature (functional unit)
↳ Task (specific task)
Why the team needs it: It provides a complete picture of the work, shows dependencies, and helps avoid missing details.
Statistics: A high-quality WBS reduces the risk of budget overruns by approximately 40%.
📥 Template: WBS Example
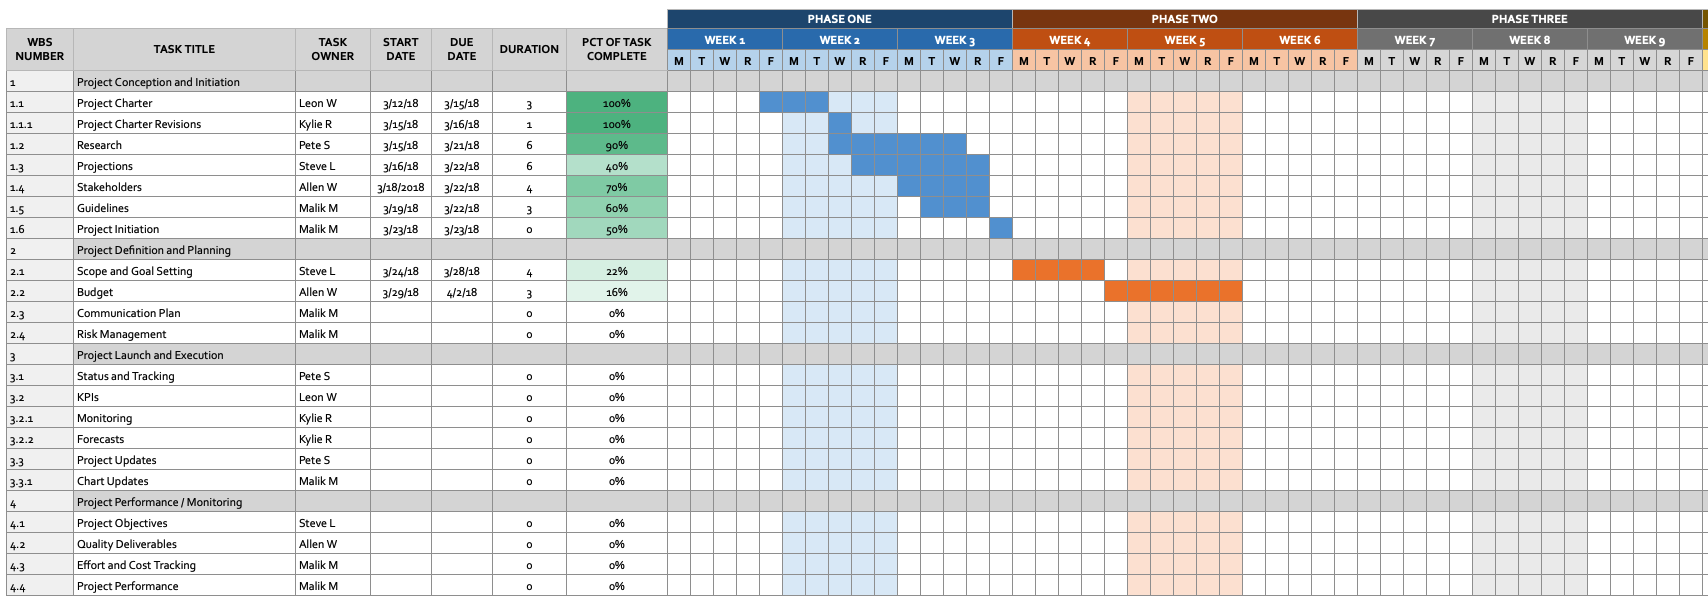
📅 2.2. Roadmap / Gantt Chart
What it is: Visualisation of the sequence of work over time.
What it contains:
- Timeline for each Epic/Feature
- Dependencies between tasks
- Critical path
- Milestones
Why the team needs it: Shows what needs to be done and when, and where the bottlenecks are.
Statistics: Projects with active Gantt charts are 25% more likely to be completed on time (Standish Group)
👥 2.3. RACI Matrix
What it is: Distribution of roles and responsibilities.
Structure:
- R (Responsible) - who performs
- A (Accountable) - who makes decisions
- C (Consulted) - who is consulted
- I (Informed) - who is informed
Why is it important for the team: Reduces confusion and prevents "passing the buck". It is important to understand who is responsible for what.
Statistics: Projects with clearly defined responsibilities are 20% more effective.
📥 Template: RACI Matrix
How to understand that planning has been successful:
- WBS has been created and detailed
- Roadmap has been agreed with the client
- RACI Matrix is filled out
- Backlog is structured
- The iteration plan does not exceed the team's resources
- The team understands all key artefacts and has a common understanding of the work structure, deadlines, and roles
- The first task moves to "In Progress"
3. Execute - The moment of truth
This is a key phase where ideas, plans, and tickets are transformed into a working product. The stability and quality of the result depend on how the team goes through this stage. Here you can see whether the previous stages have been completed properly - this is the phase where features come to life or chaos ensues.
Meta phases
Implement the planned features in compliance with the standardised quality requirements defined in the DoD.
Artifact Execute
🌳 3.1. QA & Tech Delivery Plan
What it is: An artefact that combines all the key elements of quality and predictable delivery: User Stories and Definition of Done (DoD). It is the "single source of truth" for the team, which determines when to start work and when the work is truly complete.
Such a document takes the chaos out of the process: everyone knows what needs to be prepared, what a quality ticket looks like, and what checks need to be passed before delivery.
Structure:
1. User Story
Forms a general understanding of the task from the user's point of view.
Template:
As a [role]
I want [action]
So that [value]
Acceptance Criteria:
- Criteria 1
- Criteria 2
or
GIVEN
WHEN
THEN
🖼️ Example:

2. Task-level Definition of Done
Final checklist for the quality of the completed task.
May include:
- code implemented
- code passed developer self-check (no obvious garbage, console.log, TODO shock without a plan)
- acceptance criteria for this task covered
- manually tested by dev (sanity check)
- passed peer review / code review
- deployed to test/stage environment or tested locally if it is pure FE/UI without backend
- does not break existing functionality (quick regression on critical paths)
- no Blocker / Critical bugs
- QA has set the status to "Done"
- status updated in the tracker (Jira / Notion board), description is not empty
- documentation/notes on the feature updated if it affects others (e.g., API contract, changed behaviour, new env vars)
Why the team needs it: The team clearly understands when to start working on a task and when it is considered complete. Everyone uses the same standards and checklists, which makes the process consistent and predictable. Anyone can open a ticket and immediately understand its status without additional explanations. This reduces the risks associated with incomplete, unstructured, or untested tasks. The combination of a high-quality User Story and DoD results in stable delivery, consistent sprints, and fewer returns for rework. This artefact effectively stitches together the entire delivery process - from clear task definition to final confirmation of readiness.
🔄 3.2. Ticket Lifecycle
What it is: Visualisation of the ticket's path from creation to completion.
Stages:
- There is a new request from a source: a customer, product owner, designer, etc.
- Planning - understanding what needs to be done.
- Analysis - determining feasibility, risks, advantages and disadvantages.
- Design - how this request should be implemented.
- Implementation - bringing the request to life.
- Testing and integration - checking whether the implemented version of the request meets the initial requirements.
- Maintenance - making sure that the request works without problems, and if there are any, they are quickly resolved.
Why the team needs it: Transparency of the status of each task, understanding where delays occur.
🔗 Link to the diagram: Ticket Lifecycle Diagram
📊 3.3. Status Reports
What it is: Regular reports on the status of the project.
What it contains:
- Metrics (planned vs delivered)
- Completed this week
- Plan for next week
- Blocked tasks and reasons
- Risks and issues
- Change requests
- Next steps
Why the team needs it: The client sees progress, the team stays synchronised, and the PM identifies blockers.
📥 Template: Status Report
How to understand that Execute is successful:
- Tasks are closed without endless returns
- PRs are approved without critical comments, code review is constructive
- QA confirms the fulfilment of acceptance criteria without blocking defects
- Releases without "fires"
4. Monitor & Control - Early warning system
This phase is inseparable from Execute, because the team does not simply perform tasks, but constantly evaluates the quality of work and its relevance to the goal. It is similar to an artist who occasionally steps away from the canvas to see the whole picture.
Phase objective
Track progress, identify deviations, and adjust course before problems become a crisis.
Artifacts Monitor & Control
📊 4.1. Metric Dashboard
What it is: Visualisation of key project metrics.
Key metrics: Planned vs Delivered - a metric that shows both time and budget.
Why?
- If the team is behind schedule → it's time.
- If the team delivers less than planned → it's the budget.
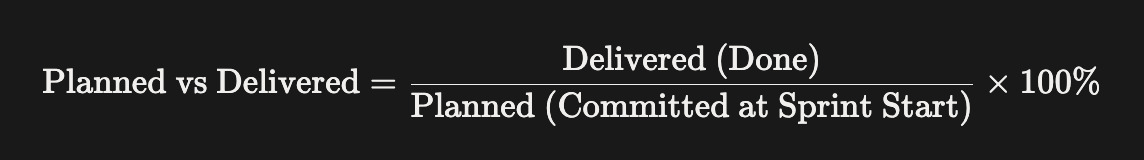
Why the team needs it: It gives an objective picture of the project. Stability is more important than "heroic sprints". If Planned vs Delivered < 80% for several cycles, it's a signal to change the approach.
Example: The team takes on 30 issues → systematically delivers 15-17. If Planned vs Delivered is consistently below 80%, you need to review your work processes, planning methods, assessments, and communications to find and eliminate bottlenecks.
Statistics: Teams with stable Planned/Delivered are 47% more likely to complete a project successfully (Scrum.org)

⚠️ 4.2. Risk Register
What it is: A living document of project risks.
What it contains:
- New risks
- Status changes of existing risks
- Implemented mitigations
Why the team needs it: To identify threats in advance, prevent them, and avoid accumulating problems that take up extra time and budget.
📥 Template: Risk Register
📝 4.3. Change Log
What it is: A register of all changes in scope.
What it contains:
- Description of the change
- Initiator and reason
- Impact on budget/timeline
- Status (Approved/Rejected/Pending)
Why the team needs it: Transparency of changes - the client understands that new requirements = additional time/budget.
📥 Template: Change Log
How to understand that Monitor & Control is working:
- Planned vs Delivered is stable (>80%)
- Risks are controlled
- Changes are documented
- There are no serial "fires"
- The client and the team read statuses in the same way
5. Closure - Completion that defines reputation
This is the moment when the team signals that the work is done, the product is ready, and everything has been tested. Delivering results is not a formality, but an opportunity to build trust. According to PMI, clear closure increases satisfaction by 25%. The end of a project is not just "the last ticket in Done," but the proper transfer and recording of experience.
Phase goal
Professionally deliver the result, build trust, and document the experience.
Artifact Closure
📊 5.1.Project Closure Report
What it is: A final project report that contains not only an assessment of the results, but also key lessons learned during the work.
What it contains:
- Final Deliverables
- Delivery Summary
- Final Metrics
- Open Items
- Risks / Notes for the Future
- Internal Mini-Retro
- Upsell / Next Steps
- Archive Confirmation
Why the team needs it: A well-structured Closure Report helps to summarise the results and form valuable experience for future projects, and often becomes an argument for contract renewal.
📥 Template: Project Closure Report
How to understand that Closure was successful:
- All materials are transferred in an understandable format
- The release is closed, accesses are transferred
- There are no "tails" on critical tasks
- Retro is conducted, insights are recorded
- The client is satisfied and understands what they have received
Conclusion: Project Lifecycle is a way of working as a system.
When the team sees the logic of the process not in fragments, but as a whole system, everything changes: there is a more accurate understanding of requirements, transparent expectations in terms of deadlines, mature engineering solutions, a stable pace, and less chaos. Communication with the client becomes honest and predictable, and the work itself becomes more manageable.
Project Lifecycle is not about documents for the sake of documents. It's about the level of the team: how it breaks down complex tasks into understandable steps and brings them to fruition so that everyone can say:
"We didn't just make a product - we did it right."
Where are all the artefacts kept?
To make this work in practice, all key artefacts are stored in the Pre Planning and Project Plan (Notion) project folders, as well as in Jira.
Business value lifecycle
Lifecycle not only provides internal order, it creates real business value:
- Stable releases without "fires"
- Fewer reworks thanks to clear requirements
- A motivated team that understands the context
- Customers who trust and return
And the ultimate meaning here is broader than internal order. It's about creating a culture of interaction where the company is seen not just as a contractor, but as a technology partner that can be relied on and recommended to others!

